Predicting ICU Mortality within the First 24 Hours of Admission: A Machine Learning Approach Using the MIMIC-III Dataset
- Kaveh Sarraf
- May 25, 2024
- 7 min read
Updated: May 27, 2024

Introduction
The rapid increase in the availability of electronic health record (EHR) data in recent years has spurred the development of machine learning algorithms for clinical decision support. One area of significant interest is the prediction of patient outcomes, particularly mortality, in intensive care units (ICUs). Early and accurate identification of patients at high risk of mortality can aid clinicians in providing timely interventions, optimising resource allocation, and improving overall patient care.
The Medical Information Mart for Intensive Care III (MIMIC-III) dataset presents an opportunity for researchers to evaluate the performance of machine learning algorithms for predicting mortality in critically ill patients. The MIMIC-III dataset encompasses a diverse patient population and a wealth of clinical information, making it an ideal resource for developing and testing predictive algorithms. In this study, we aim to leverage the MIMIC-III dataset to build a machine learning-based predictive model for ICU mortality using data from the first 24 hours of admission.
The primary research question for this study is whether it is possible to develop an accurate predictive model for ICU mortality using machine learning techniques and data collected within the first 24 hours of ICU admission. By addressing this question, our study seeks to contribute to the advancement of clinical decision support tools for ICU settings. Such tools have the potential to improve patient outcomes by facilitating early identification of high-risk patients, enabling more targeted interventions, and optimising the use of limited healthcare resources.
Method
The study focused on predicting ICU mortality using data from the first 24 hours of ICU admission, utilising the MIMIC III dataset. The data was filtered to include only the first 24 hours since ICU admission. Feature engineering was performed on several datasets to extract relevant features. This involved creating new features from the original datasets, such as binary presence flags, summary statistics, and categorical features. One-hot encoding was also used to convert categorical variables to numeric representations.
The feature engineering process was completed using various Python libraries, and the resulting features were combined into a single DataFrame for use in predictive modelling. A logger function was used to keep track of progress and notify when each feature was completed. Feature scaling was performed using standardisation to ensure each feature contributed equally to the model's performance. Pipelines were employed to streamline the process of applying transformations and estimators, simplifying the process, reducing the risk of data leakage, and making it easier to perform hyperparameter tuning using cross-validation and grid search techniques.
K-fold cross-validation was used to ensure a robust evaluation of the models' performance, with 10-fold cross-validation being employed in this study. Grid search was used in conjunction with cross-validation to find the best hyperparameters for the Logistic Regression model. Performance assessment was based on test metrics including accuracy, precision, recall, F1-score, and ROC-AUC.
Several models were tested in this study:
Logistic Regression: A linear model for binary classification tasks, estimating the probability of an event occurring based on input features. Hyperparameters were tuned using grid search and cross-validation, and performance was assessed using test metrics.
Random Forest: An ensemble learning method that constructs multiple decision trees during training and aggregates their results to make a final prediction, reducing overfitting and improving generalisation. Performance was evaluated using test metrics.
XGBoost: An optimised implementation of the gradient boosting algorithm, known for its efficiency and accuracy in various classification tasks. It constructs an ensemble of weak models and iteratively updates them using gradient descent to minimise the loss function. Performance was evaluated based on test metrics.
Gradient Boosting Classifier: An implementation of the gradient boosting algorithm, which iteratively builds weak models (usually decision trees) and combines them to make a strong model. Hyperparameters were tuned using grid search and cross-validation, and performance was assessed using test metrics.
Results
In the initial analysis, all four models, namely Logistic Regression, Random Forest, XGBoost, and Gradient Boosting Classifier, yielded perfect score metrics, indicating a strong performance in predicting ICU mortality. However, further investigation revealed one specific feature predominantly contributing to these predictions.
The top 20 feature importances were analysed, and the Discharge_Location feature, particularly discharge_location_DEAD_EXPIRED, was found to be overwhelmingly influential. Given its strong correlation with the outcome, this feature was excluded to avoid overfitting and bias.
After excluding the Discharge_Location feature, the models were retrained, and their performance metrics reassessed. Logistic Regression and Random Forest models achieved similar performance metrics, with Logistic Regression being chosen for its simplicity. The model exhibited satisfactory performance in predicting hospital mortality, with an accuracy of 0.85, precision of 0.92, recall of 0.85, and an F1-score of 0.87. However, there may be opportunities for further enhancement, particularly in terms of recall.
Table 1: Initial Performance Metrics Comparison of Machine Learning Models
Table 2: Performance Metrics of the Tuned Logistic Regression Model
Table 3: Top 20 Feature Importances of Initial Logistic Regression Model
Table 4. New Regression Model Performance Metrics
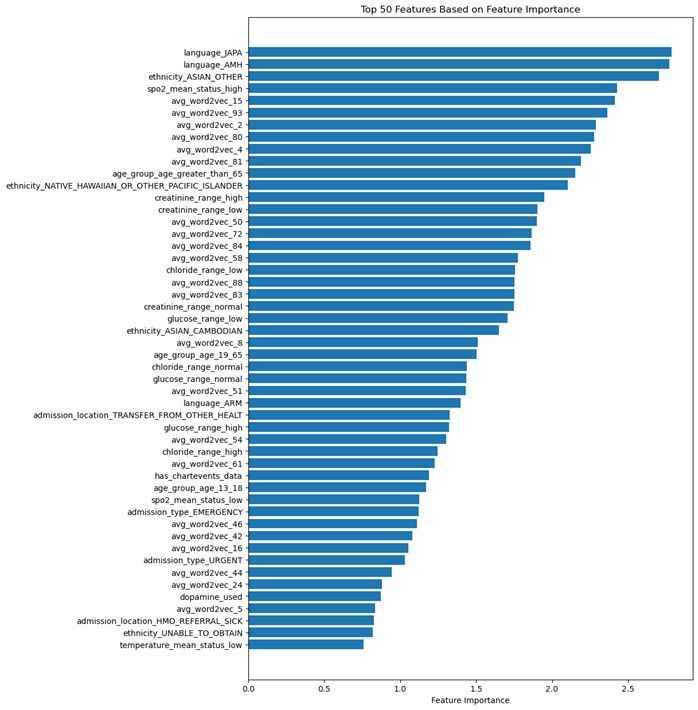
The feature importances of the tuned logistic regression model reveal that language, ethnicity, clinical measurements, age, and latent information from textual data play crucial roles in determining mortality outcomes. Linguistic factors, such as Japanese and Amharic languages, suggest an impact on the quality of healthcare and communication between patients and healthcare providers. Ethnicity also emerges as an influential factor, with certain ethnic groups potentially predisposed to specific health conditions or facing disparities in healthcare access and treatment.
Clinical measurements, such as blood oxygen saturation, creatinine levels, chloride levels, and glucose levels, serve as indicators of a patient's overall health status, organ function, or response to treatment. Age also plays a significant role in determining mortality outcomes, with older patients more likely to have comorbidities and face a higher risk of mortality. Features derived from word embeddings capture latent information from textual data in patients' medical records, providing valuable insights into health conditions and treatment outcomes.
Table 5. Top 30 Feature Importances of the Tuned Logistic Regression Model
Figure 1. Top 50 Features Based on Feature Importance

Model interpretability is essential for understanding the relationships between input features and model predictions, fostering trust in the model, and providing insights for decision-makers. In this study, SHAP (SHapley Additive exPlanations) plots are utilised to visually represent feature importance and their impact on the tuned logistic regression model's output for specific instances or groups of instances.
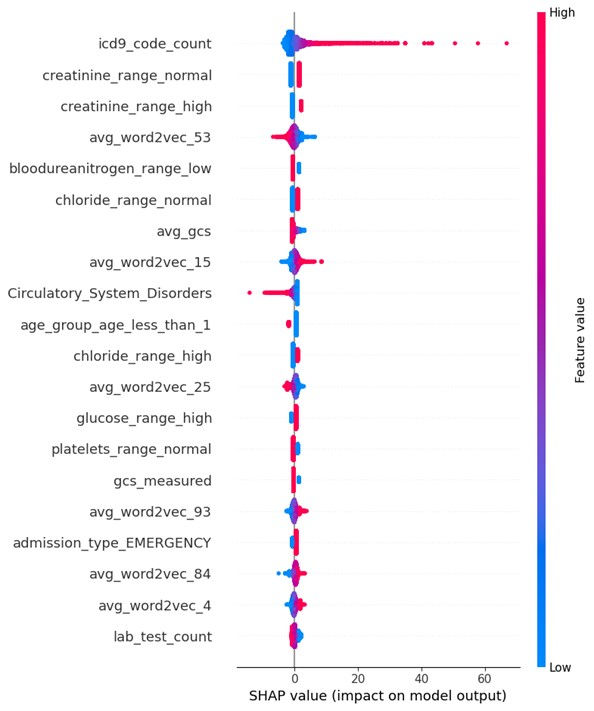
The SHAP summary plot provides a global view of feature importance across all instances in the dataset. Features are sorted by their absolute SHAP values, and the distribution of dots for each feature helps understand the relationship between feature values and their impact on predictions. A diverse impact is indicated by dots spread across the horizontal axis, whereas a consistent impact is shown by dots concentrated around a specific SHAP value. The colour of the dots (red for high values, blue for low values) further indicates the effect of high and low feature values on predictions.
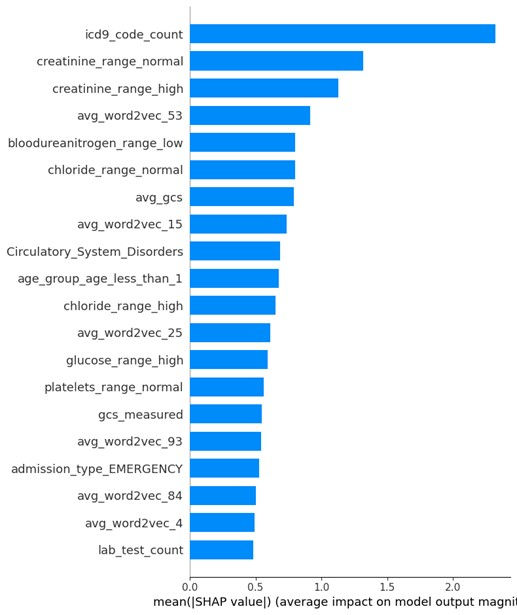
Figure 2. SHAP Values in Descending Order

In this study, the mean absolute SHAP values for each feature, sorted in descending order, reveal that features such as icd9_code_count (2.3191), creatinine_range_normal (1.3176), creatinine_range_high (1.1284), and avg_word2vec_53 (0.9157) have the most significant impact on the model's predictions. The SHAP summary plot can provide insight into the importance of these features in the tuned logistic regression model, thus contributing to model interpretability and enabling better-informed decisions based on model outcomes.
Figure 3. SHAP Summary Plot

Discussion
This study aimed to answer the question: Is it possible to accurately predict mortality based on data from the first 24 hours in ICU? The results indicate that a tuned logistic regression model can provide a relatively accurate prediction of hospital mortality using the first 24 hours of ICU data. The model achieved an accuracy of 0.92, precision_weighted of 0.91, recall_weighted of 0.92, and F1_weighted of 0.91. These results suggest that predicting mortality within the first 24 hours of ICU admission is achievable with a certain degree of accuracy.
Strengths of this study include the use of a large and diverse dataset, which provides a comprehensive representation of ICU patients. Additionally, the use of advanced machine learning techniques, such as hyperparameter tuning and SHAP plots, enhances model performance and interpretability. The study's results can help healthcare providers identify patients at high risk of mortality early in their ICU stay, thus enabling targeted interventions and resource allocation.
However, there are several limitations to consider. First, the study relies on retrospective data, which may not accurately represent the real-time dynamics of ICU patients. Second, the analysis is limited to the first 24 hours of ICU data, which may not capture the full extent of a patient's clinical trajectory. Third, the model's performance may be influenced by the quality and completeness of the data, and it is possible that some relevant features have not been included or accurately measured.
Future research should explore the use of alternative machine learning algorithms, such as deep learning models or ensemble methods, which may further improve predictive performance. Additionally, incorporating data from multiple time points during the ICU stay could provide a more comprehensive understanding of a patient's clinical trajectory and improve mortality predictions. It would also be worthwhile to investigate the impact of incorporating data from external sources, such as electronic health records, to enhance the model's feature set. Lastly, future studies should evaluate the model's performance using real-time, prospective data to better assess its applicability in real-world clinical settings.
Conclusion
In conclusion, this study demonstrates that it is possible to accurately predict hospital mortality based on the first 24 hours of ICU data using a tuned logistic regression model. While the results are promising, there are limitations to consider, and further research is needed to optimise model performance and applicability in real-world clinical settings.
References
Bray, B. D., & Steventon, A. (2017). What have we learnt after 15 years of research into the 'weekend effect'? BMJ Quality & Safety, 26, 607-610. doi: 10.1136
You can access the code used for this predictive model on GitHub by clicking on the link below:


Comments